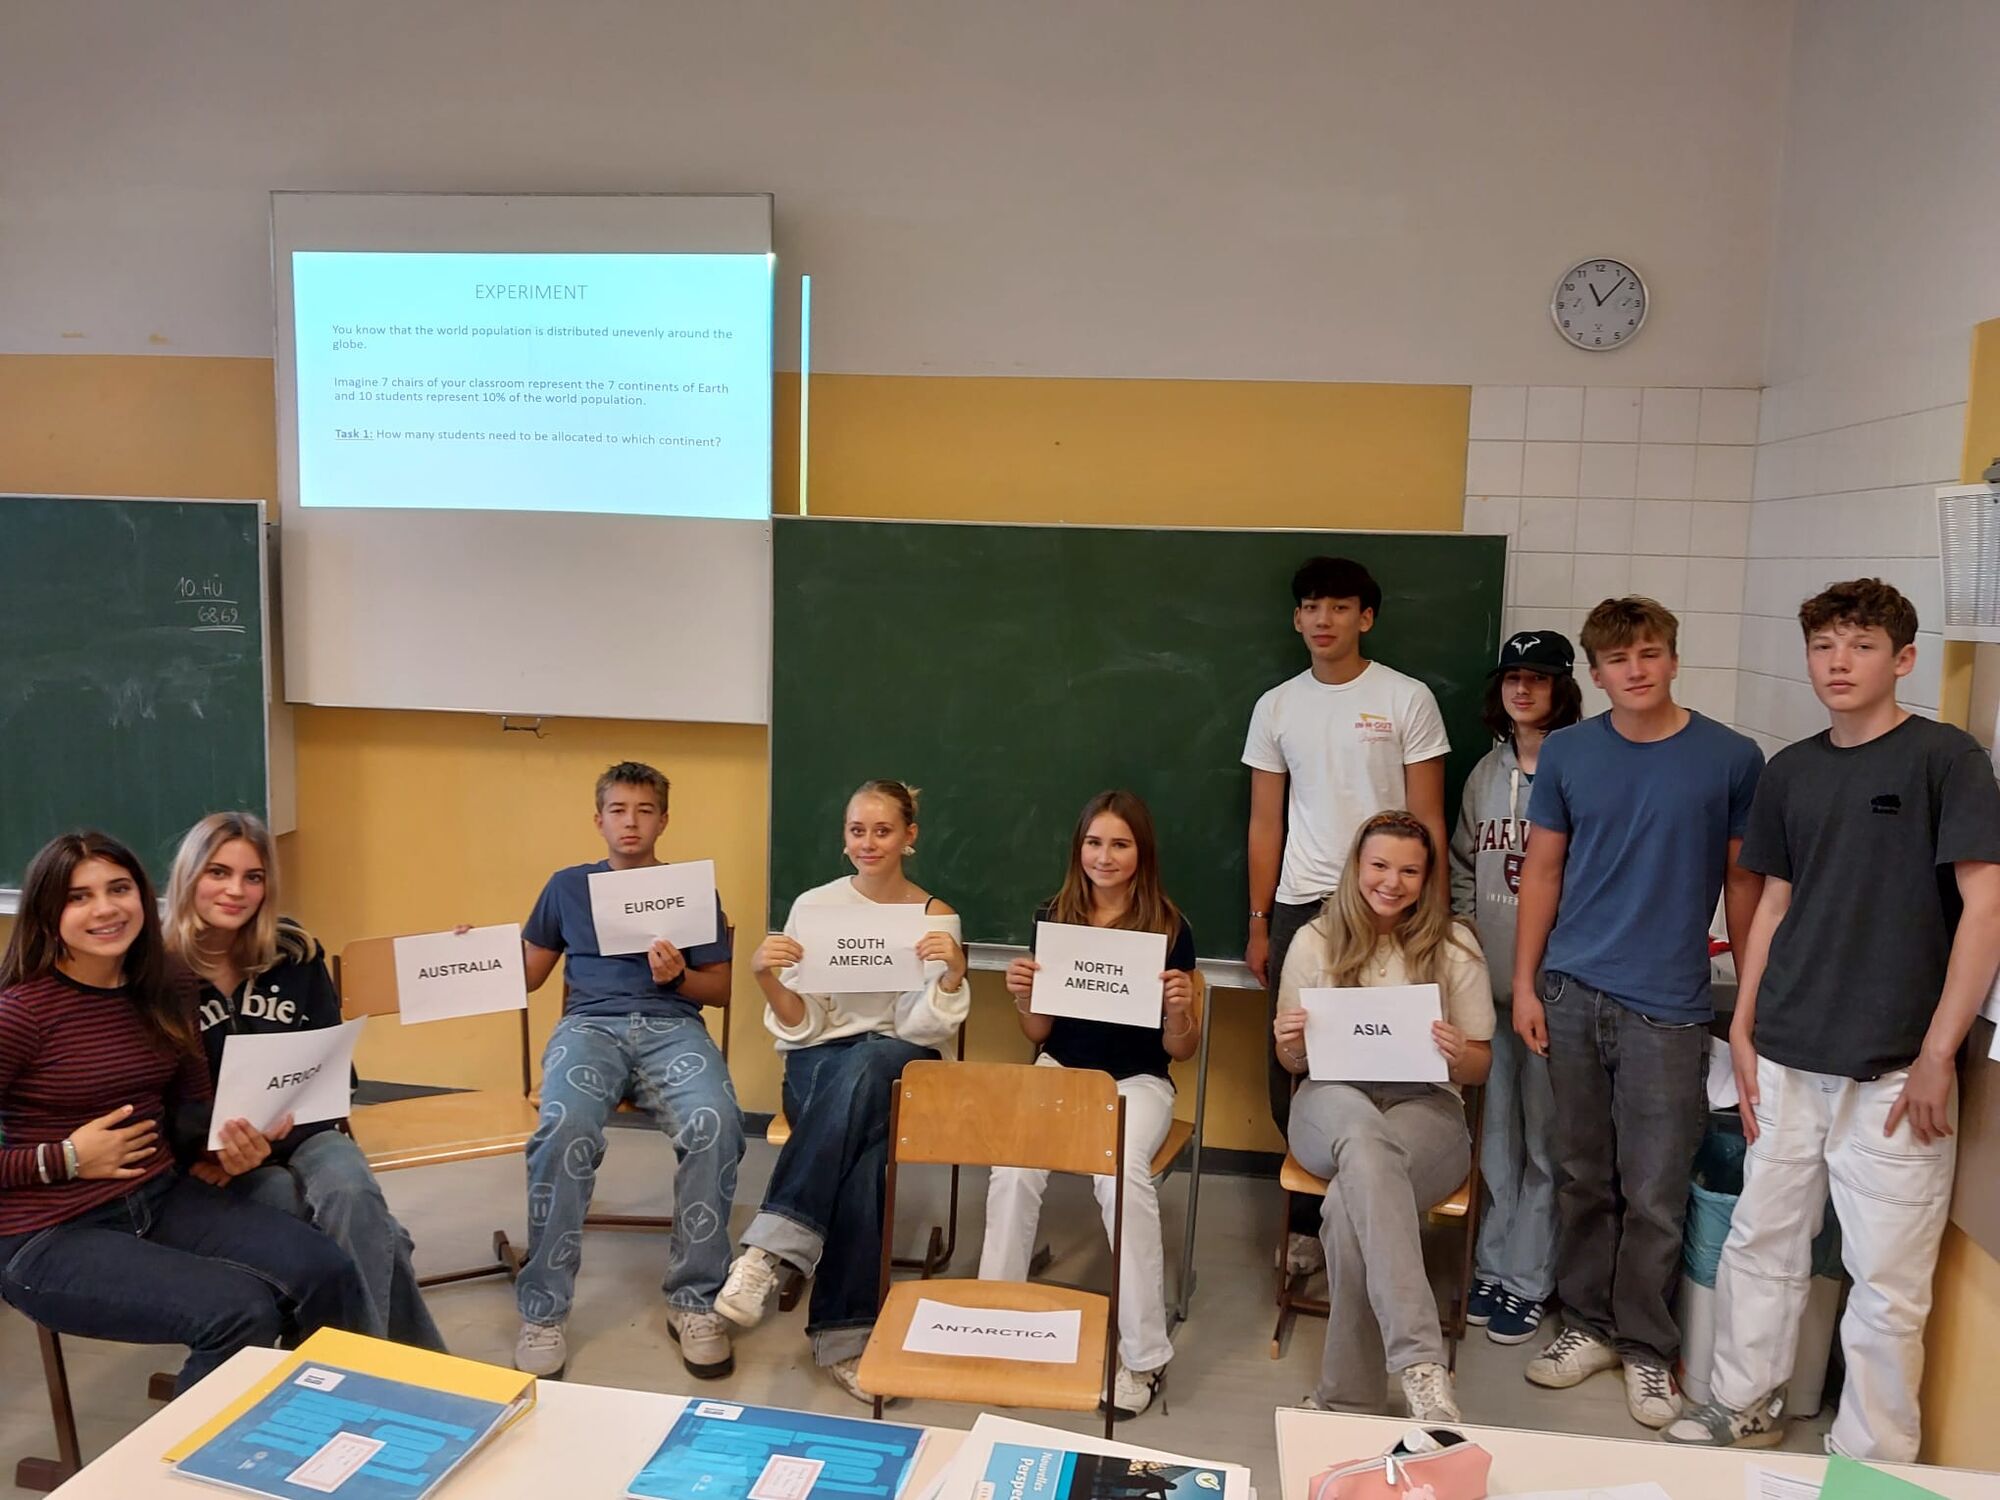
The world population’s distribution experiment with 5B
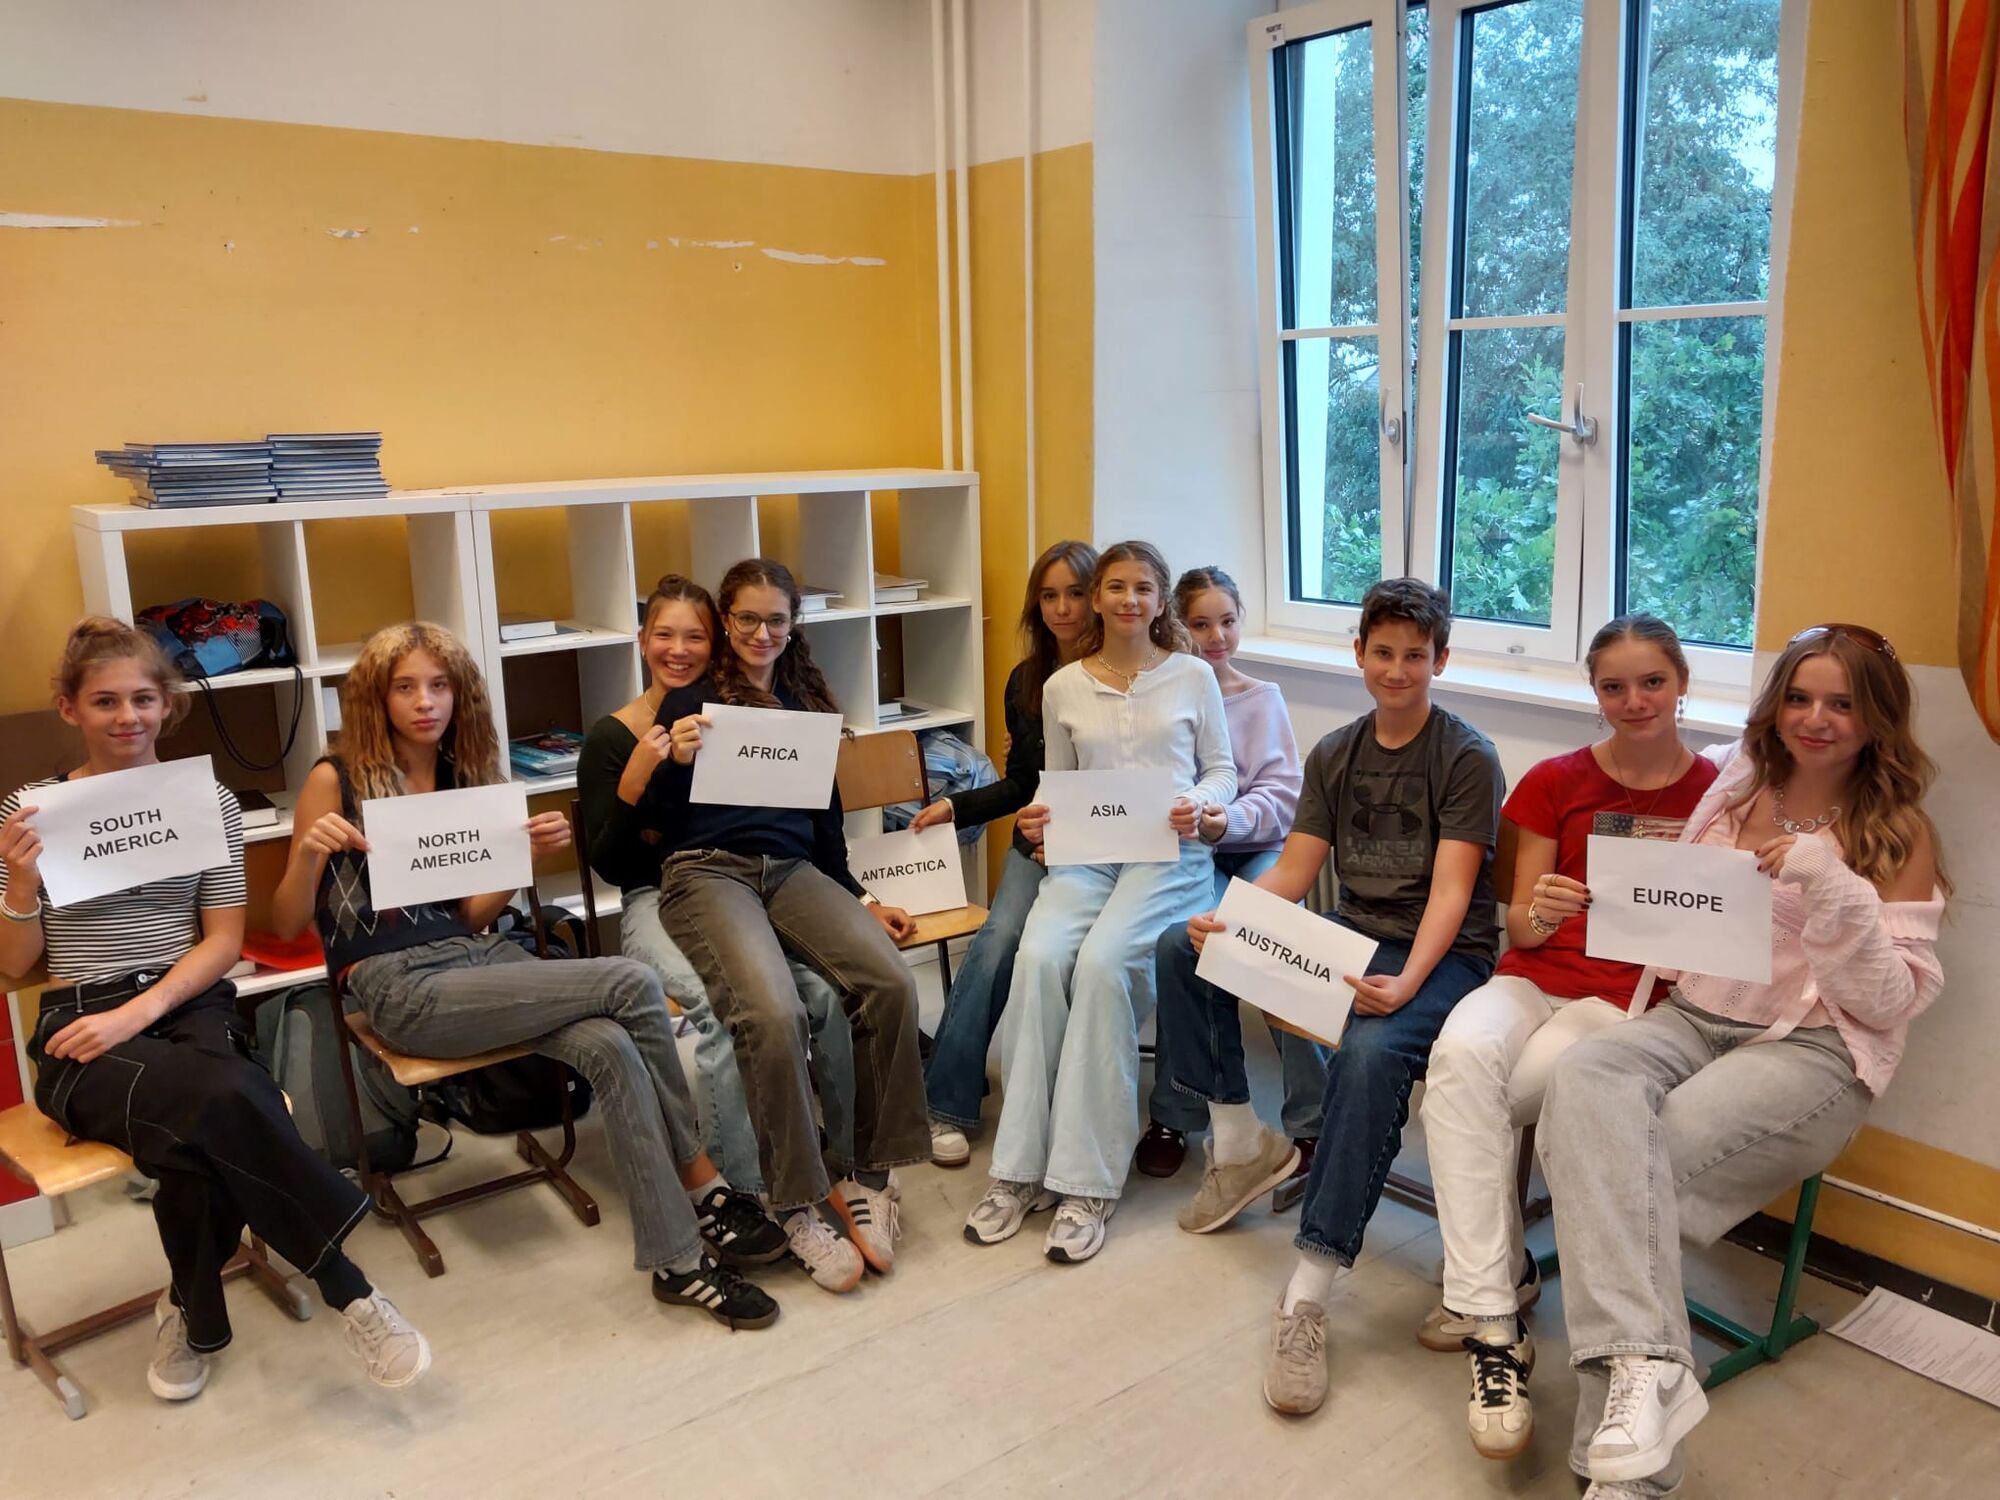
In our geography class we had a project where we had to split into two groups of ten students each. In the picture you can see our two groups’ guess of the distribution of the population.
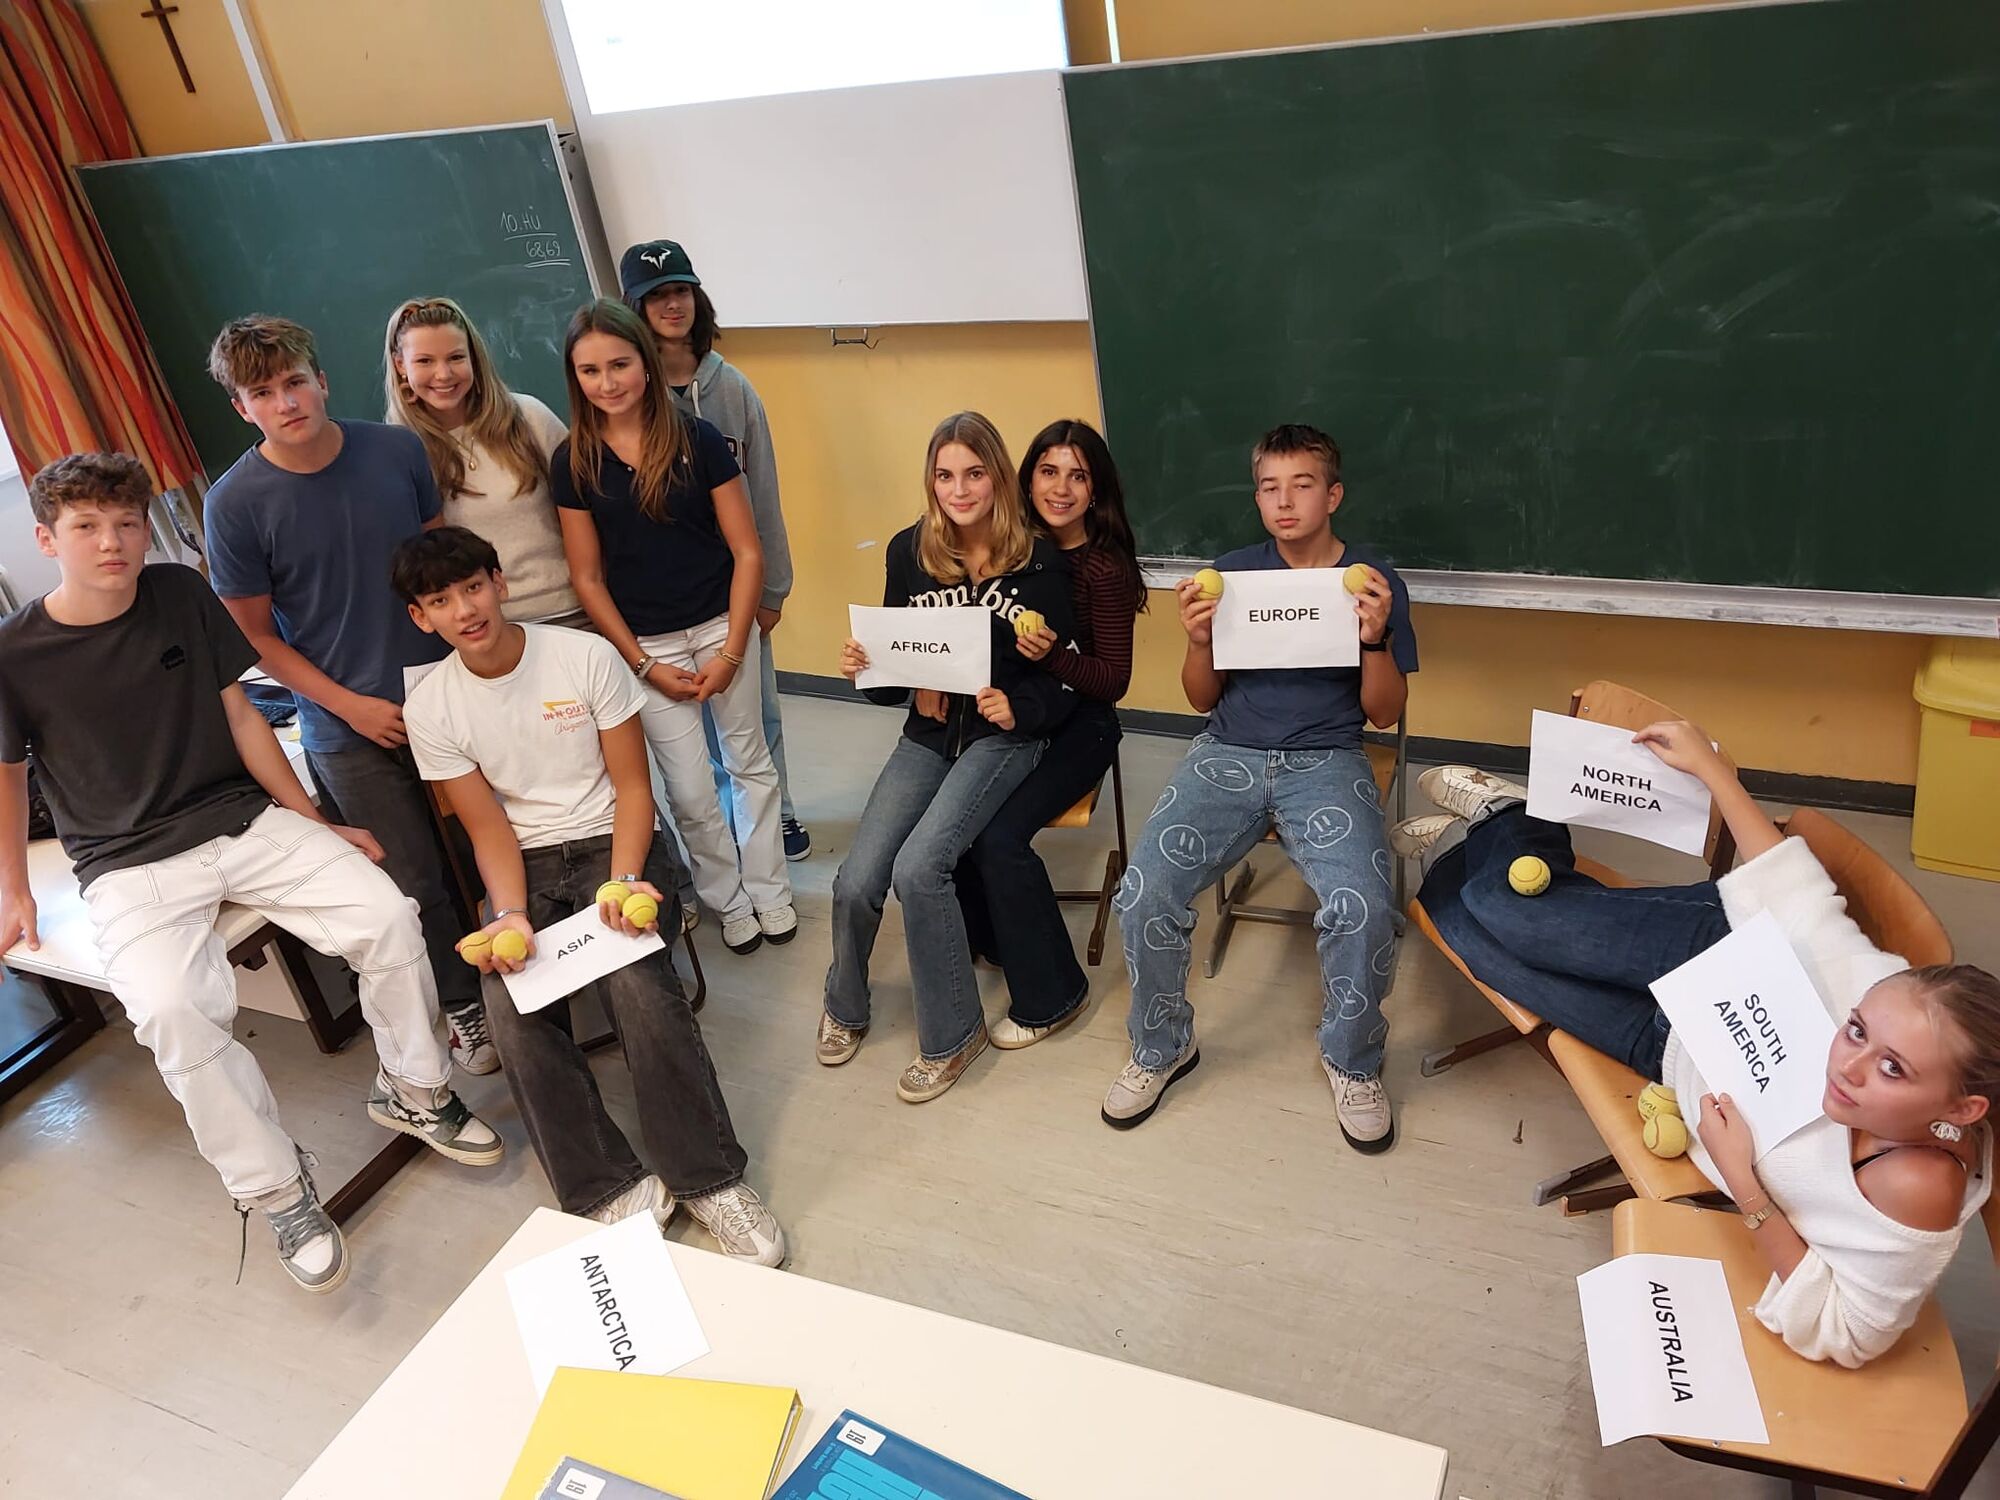
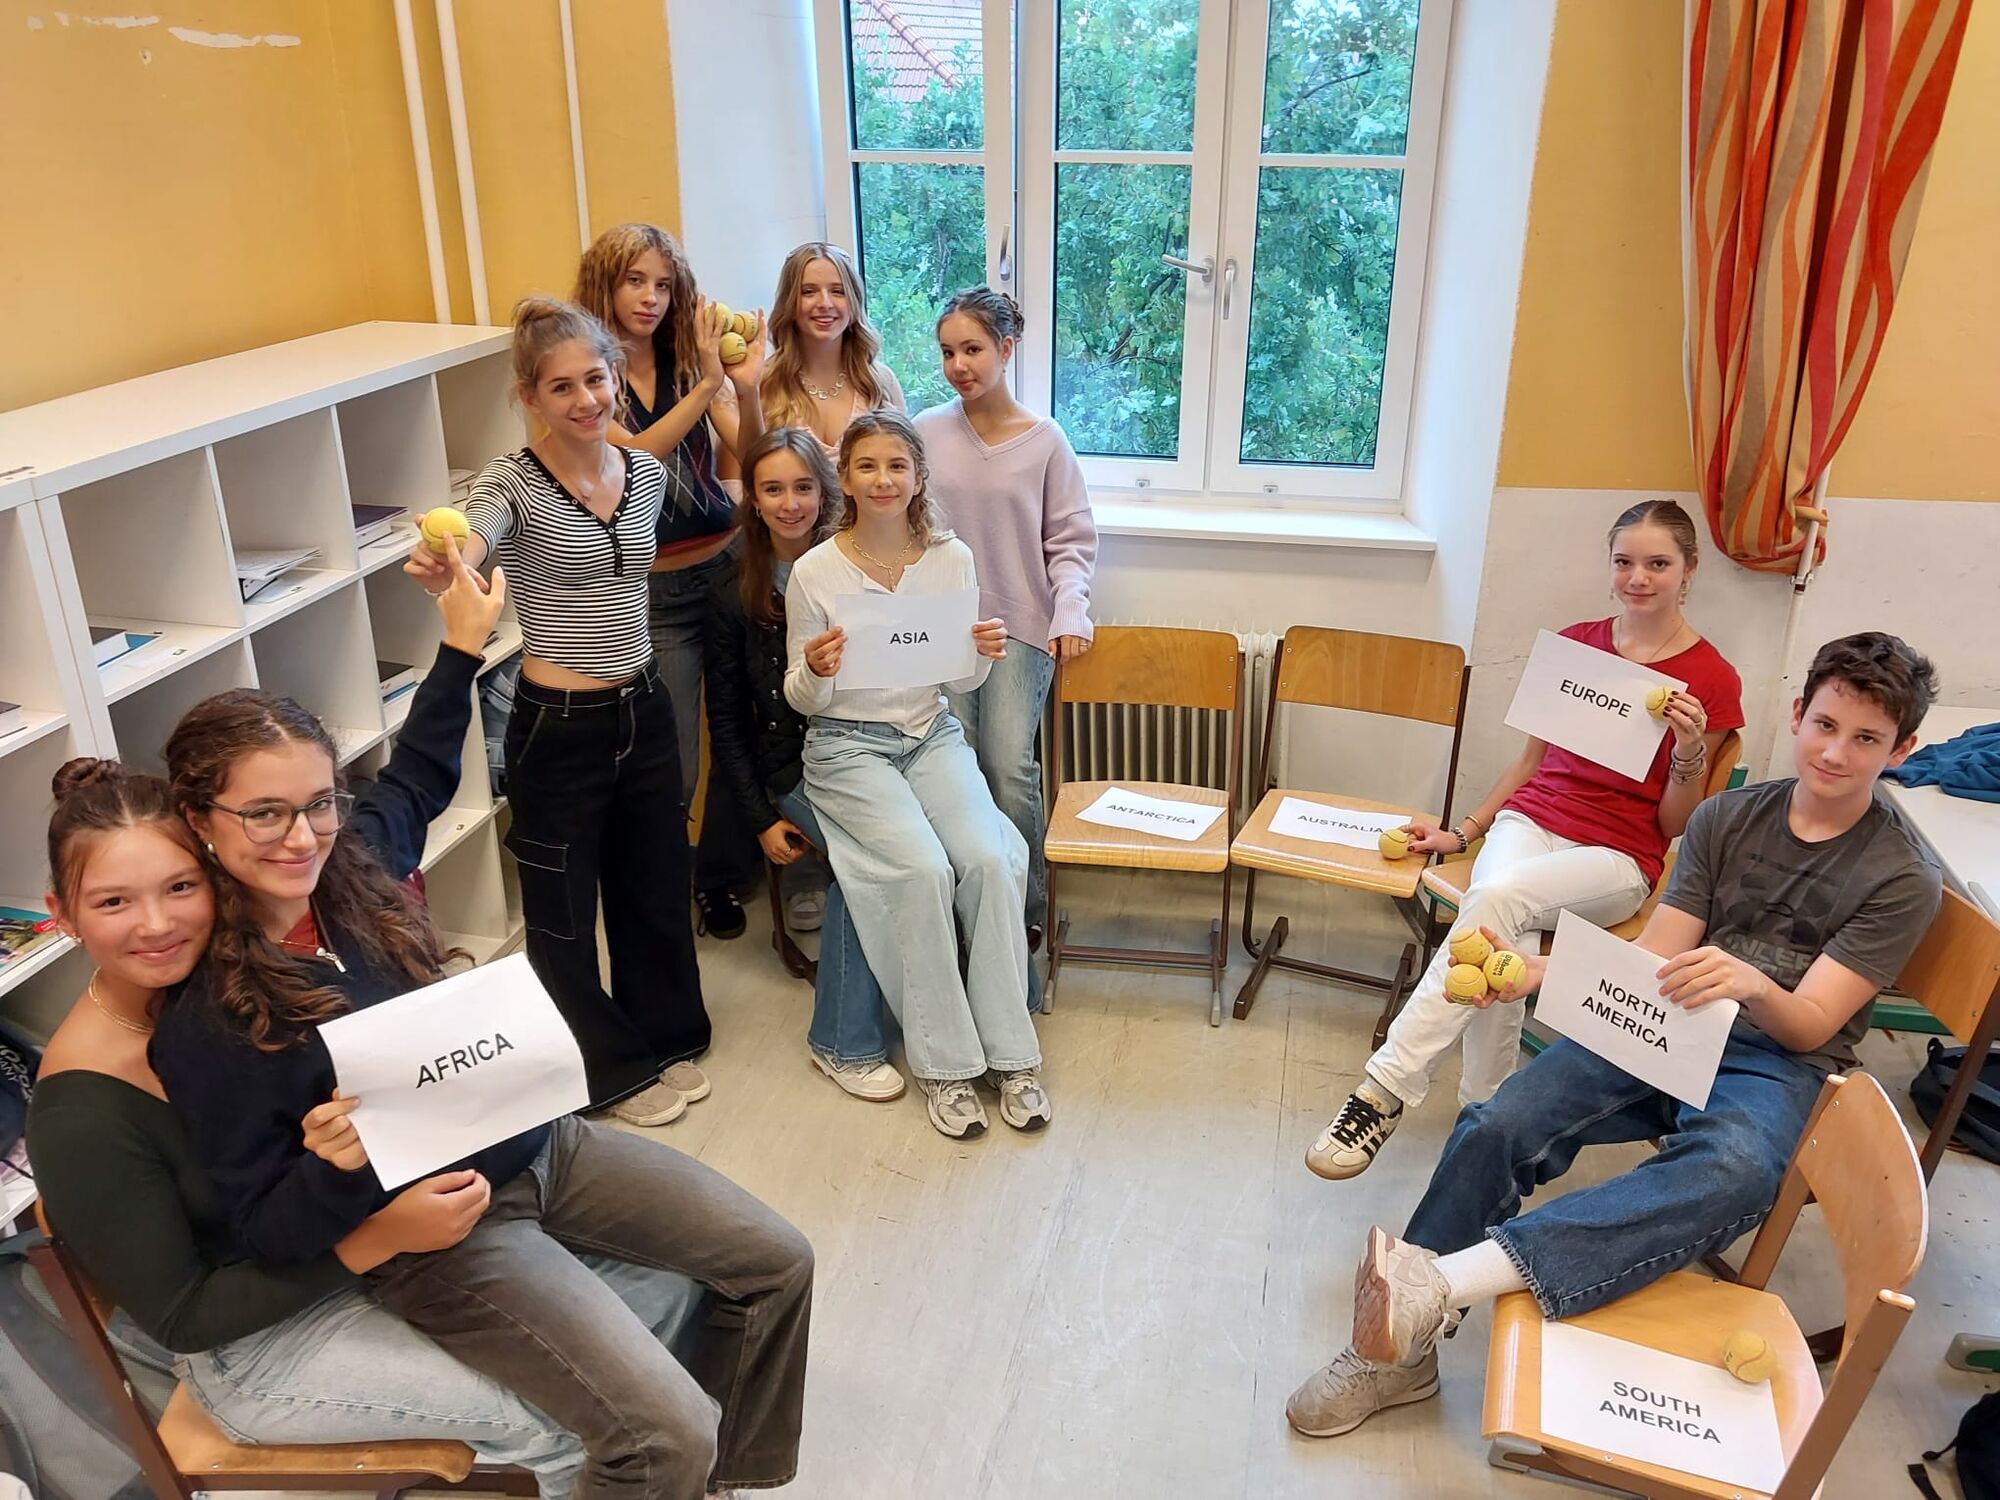
First, every group hat to represent the world population by standing in for the people on each continent. For example, six students represented Asia, one student represented Europe and so on. After that, we thought about the Gross Domestic Product (GDP) of each continent. This time we were given ten balls to represent the world’s GDP. In the pictures with the balls you can see our two groups’ guess at the GDP distribution. The distribution looked very different because some continents have a much higher GDP even though they have fewer people.
In the end, we compared both results with the actual distribution and discussed the differences between population and wealth around the world. It was very interesting to see the contrast.